
![]()

Charles Addams’ Drawn and Quartered, Bantam - June 1946.
Source: Michael Maslin:michaelmaslin.com.
If you follow housing, you may think you have a fairly good understanding of the magnitude of:
- Existing Home Sales;
- New Home Sales; and
- Foreclosures.
There’s a good chance you don’t – due to the way that the numbers are reported. Home sales are typically reported on a seasonally adjusted and annualized basis, while foreclosures are not. As a result, even careful readers may have missed the extent to which foreclosure-related activity now dominates the housing market.
Consider the following typical Bloomberg news stories:
Sales of US New Homes in March Exceeded Forecast
April 24 - Purchases of new homes in the U.S. last month were higher than anticipated, providing further evidence the market may be stabilizing.
Sales decreased 0.6 percent to an annual pace of 356,000 after a 358,000 rate in February that was stronger than previously estimated, the Commerce Department said today in Washington…
US Existing Home Sales Dropped More Than Forecast
April 23 - Sales of U.S. previously owned homes fell in March after jumping a month earlier by the most in more than five years, indicating the market will remain depressed for much of the year.
Purchases decreased 3 percent to an annual rate of 4.57 million, lower than forecast, from 4.71 million in February, the National Association of Realtors said today in Washington….
Foreclosure Filings in US Climbed to Record in First Quarter
April 16 - U.S. foreclosure filings rose to a record in the first quarter as employers cut jobs in the recession and temporary programs to delay action on defaults came to an end, RealtyTrac Inc. said.
A total of 803,489 properties received a default or auction notice or were seized, 24 percent more than a year earlier, RealtyTrac said in a statement today…
If I held a pop quiz you might remember the following:
- New Home Sales: 356,000
- Existing Home Sales: 4.57 million
- Foreclosure Filings: 803,489
And if you got all of these right, and firmly fixed in your brain, then you’d be wrong.
This is because the first two figures are seasonally adjusted and annualized tallies of the number of new and existing homes sold in the month of March. Virtually no one ever reports the actual, unadjusted, home sales figures.
The last figure is the number of foreclosure filings that occurred during the first quarter of 2009, without adjustment or annualization.
To see what a difference seasonal adjustment and annualization makes for home sales, consider the following monthly home sales charts (Figure1 and Figure 2), below.
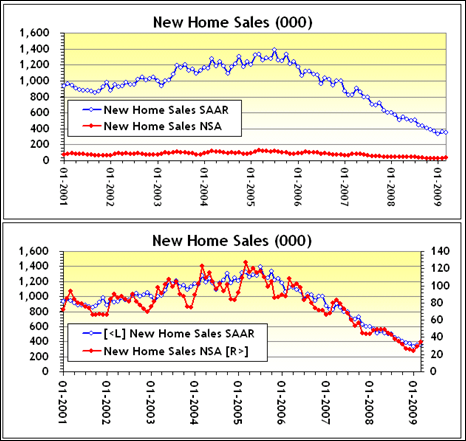
Figure 1: New Home Sales, Seasonally Adjusted Annual Rate & Not Seasonally Adjusted
Top: Common Vertical Axis Bottom: Separate Vertical Axis, Left and Right
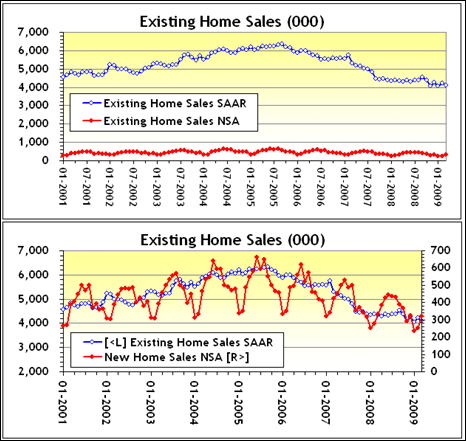
Figure 2: Existing Home Sales, SAAR & Not Seasonally Adjusted
Top: Common Vertical Axis. Bottom: Separate Vertical Axis, Left and Right.
Because of the wide seasonal variation in home sales (seen in the sawtooth of the non-seasonally-adjusted [NSA] red lines above), new and existing home sales are typically reported on a seasonally adjusted and annualized rate [SAAR] basis.
Foreclosures, however, are NOT reported on a seasonally-adjusted basis, they are reported on an unadjusted basis.
If all three series – new home sales (from the Commerce Department), existing home sales (from the NAR), and foreclosure starts (from the Mortgage Bankers Association, since I don’t have historical RealtyTrac® data) are plotted on an annualized basis, you get the following chart (Figure 3).
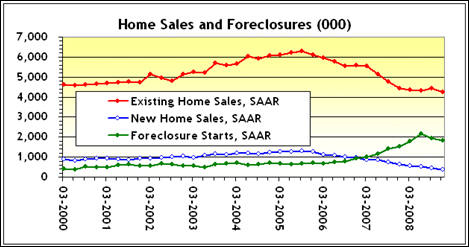
Figure 3: Home Sales and Foreclosure Starts, On Annualized Basis
If we re-represent foreclosure starts as a percentage of existing home sales and new home sales, respectively, then we get the following chart, Figure 4, that indicates the extent to which foreclosures have become as important as home sales.
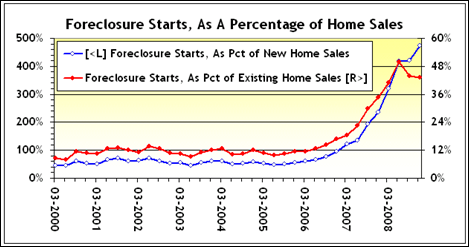
Figure 4: Foreclosure Starts, As A Percentage of Home Sales
As indicated, from 2000 until 2005 foreclosures (on an annualized basis) represented something like 50% of annualized new home sales and about 10% of annualized existing home sales. As of year-end 2008, foreclosure starts (temporarily suppressed by lapsing foreclosure moratoria) were about 470% of new home sales and about 45% of existing home sales.
Nationwide, foreclosures are now commencing at a rate that is roughly half that of existing home sales, and almost five times that of new home sales, when each is represented on a similar, annualized basis. In the former bubble regions – (such as AZ, CA, FL, and NV) foreclosures are even more important.
- Note: For a regional analysis of the importance of foreclosures in “bubble states”, see G. Nechayev and W.C. Wheaton, Torto Wheaton Research, Foreclosures: Where Is The Problem, 6 March 2009.
So, the next time you come across an account of monthly or quarterly foreclosure activity, don’t forget to multiply the figure by twelve or four, to come up with a more-or-less annualized figure.
![]()
I used to work with numbers for a living. Have to cut out for a moment and pick up a quart of milk, but then I’ll resume my search for a new job, or at least my next idea. Till next time.



2 responses so far ↓
1 Foreclosures, Home Sales and Profit Motive | Photomaniacal // Apr 26, 2009 at 9:53 pm
[...] in “Drawn and Quartered”, Ira both illustrates the differences between seasonally adjusted, non-seasonally adjusted and [...]
2 Ira Artman’s Sterling Slivers: Home Sales In The Rear View – Does it work? // May 5, 2009 at 12:03 pm
[...] week, I observed (see Drawn and Quartered – Home Sales and Foreclosures) that seasonal factors plague monthly home sales – winter home sales are typically much lower [...]
Leave a Comment