

![]()
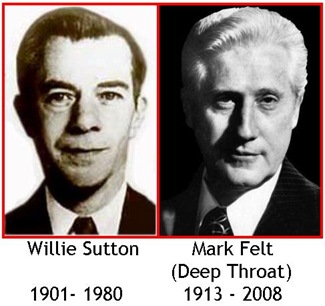
Source: WS & MF (DT), Wikipedia.
Willie Sutton: “Why do I rob banks? Because that’s where the money is.”
Deep Throat: “Follow the money. Just … follow the money.”
Thirty years ago, Willie Sutton confirmed that he NEVER said the words to which he will be forever linked. Two years ago, Mark Felt did the same. This year, your government is holding a cut-rate New Year’s party in their honor, and all banks - small and large - are invited.
But all banks that attend (and all must) will find that they have been invited NOT because the government is “following the money.” Rather, the government is “reallocating their capital.” The small banks will end up on the losing side of this trade, which is truly “an offer that they cannot refuse.”
MOTIVE, MEANS, and OPPORTUNITY
To convince a jury of a defendant’s guilt, it helps if you can demonstrate that the defendant had the motive, means, and opportunity to commit the crime for which he is charged. This refers to the:
- Motive: The reason the defendant had to commit the crime;
- Means: The ability of the defendant to commit the crime; and
- Opportunity: Did the defendant have the opportunity to commit the crime.
I will suggest below that the government (specifically the Fed and the US Treasury) possesses both the Motive and the Means, the first two components of the triad. Since the ‘crime’ or event has not yet occurred, it is understood that the Opportunity is nigh.
MOTIVE – FOLLOW THE NUMBERS
Let’s begin at the beginning. If you’re working with “core capital”, and piece together a timeseries from the FDIC’s Quarterly Data Books, you can go back to 1992:
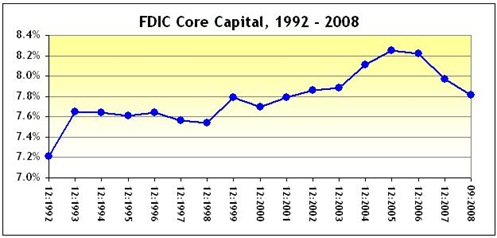
Figure 1: Core Capital 1992 - 2008
“Core capital” measures a bank’s financial strength from a regulator’s point of view and consists primarily of equity capital and cash reserves. Regulators, such as the FDIC, require banks to hold capital to provide protection against unexpected losses.
As my above chart indicates, 2005 represented a “high water mark” for the industry, as core capital reached a level of about 8.25%. It has been drifting downward ever since. If ever there was a good time for banking over the last seventeen years, that year would be 2005.
Let’s now take a closer look at the distribution of core capital across the banking industry, based on asset size, using data from the FDIC Quarterly Banking Profile. We’ll look at both the 2005 “high water mark” as well as “now”, i.e. 2008Q3, the last available report.
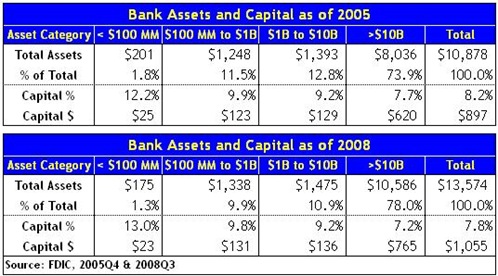
Figure 2: Capital by Asset Size Category, 2005Q4 vs. 2008Q3
Several things are apparent from the above:
- Smaller banks tend to have higher capital ratios than larger institutions;
- Industry assets have become more concentrated in the largest banks as the average size of the largest increased by about 36% between ‘05 & ‘08. However, the absolute number of the largest banks did not change by that much;
- The average size of all-but-the-largest was virtually unchanged between 2005 and 2008;
- The noted decline in aggregate capital ratios between 2005 and 2008 reflected a significant decline in the core capital of “just” the largest banks, for which the capital ratios declined from 7.7% in ‘05 to 7.2% in ‘08. Other size tiers “held their own” or increased their capital ratios; and
- The smallest banks are really small (average size $54 million), and the large banks are really big (average size $93 billion).
Compared with the “glory days” of 2005, it should then be clear that the current “financial crisis“, when measured by capital, is primarily confined to the roughly 120 largest banks in the country. However, these large banks account for almost 80% of the total bank assets. The 8,300 [!] smaller banks hold the remaining 20% of bank assets.
In a capital-centric view, the current crisis among the largest banks expresses itself as a seemingly slight decline in their aggregate capital ratio, from 7.7% to $7.2%.
- Note: While the capital ratios for the largest banks declined, the total capital of these banks actually increased, from $620 billion to $765 billion. The divergence between the change in ratios and dollars is “explained” by the fact that the total assets of the largest banks increased from $8.0 trillion in ‘05 to $10.6 trillion in ‘08.
- While numbers such as these - $10 trillion - seem large, it may help to express them in more concrete terms. So here’s one attempt. There have been recent reports about an alleged $50 billion “Ponzi Scheme”. If we had about 210 more of those Ponzi schemes, and all of the losses were confined to the largest banks, it would wipe them all out. Hope that … helps.
MOTIVE – FOLLOW THE STORY
The Nov/Dec 2008 issue of Washington Monthly contains an article, Too Small To Fail, that puts a name and face to the story suggested by my figures - large banks are underperforming while smaller banks thrive. I will provide a quick summary, but I hope you will read Longman, Frank, and Seidman’s complete work at Washington Monthly’s website.
Simply put, smaller banks - such as Broadway Federal Bank in Los Angeles - have been flourishing.
Broadway Federal, a 60 year old $400 million bank, sports a loan “portfolio divided more or less equally among single-family homes, apartment buildings, churches, commercial real estate, and small businesses.” It has a higher ROE & ROA, and a lower proportion of non-performing loans, than some highly regarded large institutions, and this is a typical “community bank” story.
This is due to five factors. Community banks:
- Did not follow the “under regulated giants” into the subprime business;
- Focused on niche affinity groups to enhance their community ties;
- Specialized in “relationship banking“. Large banks followed the “transactional banking” model, “in which formulas and set calculations govern lending decisions”;
- Unlike those that embraced transactional banking, maintained a “stake in the long-term outcomes of their transactions” by holding on to their loans, rather than selling them; and
- Had limited access to the capital markets, and this encourages them to “inculcate thrift” among their depositors.
Longman, Frank, and Seidman suggest several ways to enhance the position and stability of community banks. These include:
- Elimination of predatory lenders;
- Establishment of a federal “Community Bank Trust Fund” to provide the closely held community banks with additional equity capital as they struggle with a deposit “upsurge”; and
- Taxation of large banks’ securitizations, with the proceeds funneled into the “Community Bank Trust Fund”.
MOTIVE – FOLLOW THE CURRENT CARNAGE
Longman, Frank, and Seidman describe how and why community banks should be encouraged. However, federal officials seem to be about to do the exact opposite, as they focus on a financial system that is rotting from the top down.
Consider, for example, the words of the US Treasury Secretary in an 18 Nov 2008 New York Times Op Ed. He is clearly focusing on the problems at the top:
- WE are going through a financial crisis more severe and unpredictable than any in our lifetimes. We have seen the failures, or the equivalent of failures, [of nine large financial institutions, and each] … of these failures would be tremendously consequential in its own right…
- There is no playbook for responding to turmoil we have never faced. We [are] …keeping focused on our goal: to stabilize a financial system that is integral to the everyday lives of all Americans…
- As policymakers face the difficult challenges ahead, they will … deal with the future capital and liquidity needs of credit providers.
Source: Henry Paulson, New York Times Op Ed, Fighting the Financial Crisis, One Challenge at a Time, 18 Nov 2008.
Now, as David Mamet wrote in his Glengarry Glen Ross tribute to real estate swindlers, it’s time to “listen to what I’m going to tell you now.”
THE MEANS – FOLLOW THE NUMBERS
The previous tables indicated that since the “high water mark” of 2005Q4, the capital ratios of the largest banks have declined while those of the remaining banks were relatively unchanged or higher [See Figure 2].
The table below provides a rough indication of what the industry would look like if capital ratios for all size categories were equalized to the 2008Q3 average of 7.8%.
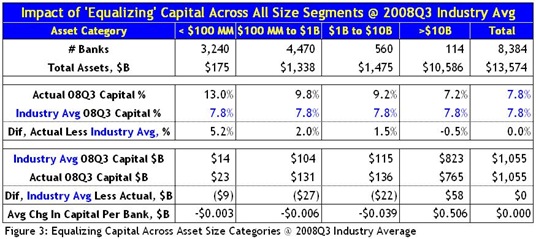
This is not to suggest that any “equalization” - if it occurred - would occur in precisely this manner. Rather, the table simply provides a series of benchmarks of the amount of capital that would have to be transferred, across size segments, in aggregate and for each institution.
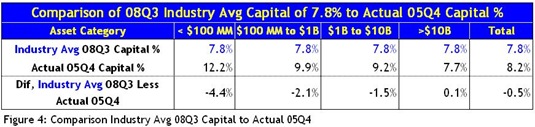
We can then compare the result, in which all industry segments have the same capital ratio of 7.8%, with the capital ratios that prevailed at the 2005Q4 “high water mark.” See the table below for this comparison:
Note that this rebalancing does not require that any additional capital be added to the industry in aggregate. It simply suggests what things could look like if things were to be “moved around a bit” within the industry.
This is not that different from what occurred during the S&L Crisis that occurred at the end of the 20th century. At that time, the bailout produced cost-shifting in the form of higher FSLIC (and then FDIC) insurance premiums, as surviving institutions paid part of the costs of closing down the failures.
What’s different this time (as we shall see below) is that regulators have modified the cost-shifting to reflect 21st century realities and business models. Specifically, today’s cost-shifting relies upon the continued existence of securitized funding sources that are cheaper than traditional “balance sheet” funding.
Three things are apparent from the above two tables:
- If capital were equalized at 2008Q3 levels, the capital ratios for the largest banks would be higher than they were during the 2005Q4 high water mark [see Figure 4];
- The amount of capital to be transferred to the largest banks, $58 billion, is about the size of one good 21st century Ponzi scheme [see Figure 3]; and
- The smallest banks would lose about $3 to $6 million per bank [i.e., $0.003B to $0.006B], the large banks would lose about $40 million per bank [i.e., $0.039B], and the largest banks would gain about $500 million per bank [ i.e., $0.506B, see Figure 3].
Please note that I am NOT suggesting that this equalization/transfer SHOULD provide an additional $58 billion of capital to the largest banks. Rather, I am simply pointing out that IF it did occur, and was of this scale, then it would restore the capital ratios of the largest banks to above that which prevailed during the 2005Q4 “high water mark.”
Second, I am NOT suggesting that I have any opinion about the survivability of the smallest 3,240 banks, if their capital ratios were reduced by more than half. That’s a question for their regulators. But with all of the things that the regulators have to focus on these days, it sure must be a real bother to keep tabs on the close to 40% of all banks, by number, that represent about 1% of all assets.
THE MEANS – FOLLOW THE STORY
Mark Sunshine is the President of First Capital, a secured lender based in Florida. He writes a daily blog called “Sunshine Notes”, and below is an excerpt from his How The Fed Is Making Banks Lend post of 19 Dec:
- The Federal Reserve is forcing banks to lend or face financial disaster. The Fed’s latest strategy gives banks the stark choice of lending or losing a lot of money from operations. Everyone knows the Fed cut its target Federal Funds rate to the bone this week. In a less obvious move, the Fed is also forcing down rates on Treasury bonds and other securities. As a result, banks have the choice of buying bonds that yield less than their cost of funds or lending. Any bank that decides not to lend will suffer losses. Cash is trash and if banks don’t recycle it, they will slowly bleed to death.
- The Federal Reserve is returning banks back to the lending business in two ways.
- First, the Fed is providing banks with cash to lend by dramatically increasing money supply…
- [Second, the] … Fed has starting purchasing the cash equivalent investments that banks are buying and in the process driving down yields. Banks are losing money on their formerly safe investments because their all-in cost of deposits is higher than the yield they are earning from cash equivalent investments…
- The types of investments that the Fed is initially targeting to drive down yields include Treasury securities, Federal Funds, Agency bonds and Agency and government guaranteed mortgage backed securities…
- The Federal Reserve has put banks between a rock and a hard place. Either they lend, or destroy their institution with a negative interest spread and risk regulatory discipline. The Federal Reserve has morphed the strategy of hoarding cash equivalent investments into a very risky decision…
Source: Mark Sunshine, First Capital - How The Fed Is Making Banks Lend, 19 Dec 2008.
Consider, for example, the rates on the 30 Yr GNMA Current Coupon MBS:
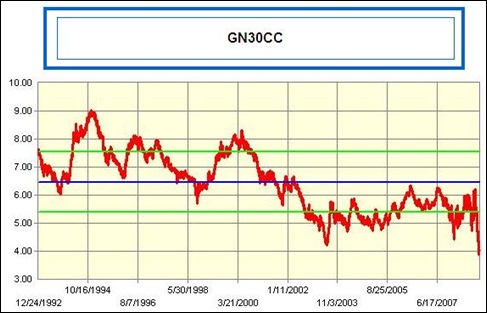
Figure 5: 30 Year GNMA Current Coupon Yield
As indicated by the above chart, these rates have averaged about 6.50% since 1992, but have currently dipped (consistent with Sunshine’s remarks) to about 4.00%.
According to Bankrate.com, the average rates on 1 Yr - 5 Yr CD’s range between 2.85% to 3.35%. After adding overhead of roughly 2.00% to these yields (see Sunshine’s complete post), you have an all-in CD with a cost between 4.85% to 5.35% - which would be higher than the yields on the GNMA’s. Once again, this is consistent with Sunshine’s post.
To put it another way, recent rate moves have largely put an end to the relationship-based, balance sheet lending model followed by the community banks profiled by Washington Monthly. In order to “turn a profit”, they will be compelled to start selling off, or securitizing, their loans to take advantage of the relatively low cost “funding” that is now available in the secondary market.
As the smaller banks sell off assets that no longer make sense on their balance sheet, they will be turning them over to the large bank aggregators. This is because the largest banks, unlike the smallest, have used their size and clout to achieve or negotiate rock-bottom securitization and servicing costs. Smaller banks will not be able to duplicate these terms. As this process continues, the larger banks will earn, - good, bad, or indifferent - a larger portion of the revenue stream than they had previously received, and which had enriched the smaller banks.
CONCLUSION
Will these changes in the business model of the smaller banks be significant enough to shift $58 billion in retained earnings and capital from the books of the smaller banks to the largest? Surely not all at once. Over time it will gradually increase the earnings and capital of the largest banks, at the expense of the smaller. From a macro view, it assists the Fed and Treasury in their intended recapitalization of the largest banks.
The Fed and Treasury are now calling the tune at their cut-rate New Year’s Party. Time to follow the leaders.
- - - - - - - - - - -
![]()
I used to work with numbers for a living, but can’t say when the good times will follow the bad. I continue to search for a new job or my next idea. Till next time. Happy New Year.
REFERENCES & ACKNOWLEDGEMENTS
![]()
![]()
![]()
FDIC, Quarterly Banking Profile & Graph Book, 2005Q4 & 2008Q3.
P. Longman, T.A. Frank, E. Seidman, Washington Monthly - Too Small To Fail, Nov/Dec 2008.
M. Sunshine, First Capital/Sunshine Notes - How The Fed Is Making Banks Lend, 19 Dec 2008.
Thanks to Susan Kulakowski for her suggestions regarding the layout of Figures 3 and 4.


1 response so far ↓
1 Ira Artman’s Sterling Slivers: No News Is … No News – Banks, Home Prices, and Home Sales Are Just Fine // Apr 22, 2009 at 2:43 am
[...] of banks.” The problems were, and are, confined to the largest banks, as I described earlier in Follow The Money and A Little Off The [...]
Leave a Comment