

![]()
 If Chairman Bernanke’s best efforts have greened (i.e., to make or become green) the shoots of economic recovery, what would cause him to cede his current position, stand up, and leave?
It would be unusual for a successful sitting Fed Chair to leave after one term (about as rare as a standing panda). But let’s take a look at history and “determine” what would be needed to make Chairman Bernanke a one-term Chairman of the Board.
To do this, I will:
- Briefly review the terms of modern-era Fed Chairmen;
- Invoke a well-known metric to benchmark their performance;
- Develop a model that relates their length-of-service to this benchmark; and
- Calculate the performance level required to make Chairman Bernanke a one-termer.
Historical Review of Fed Chairmen
Since the Fed’s 1913 inception, there have been eight Chairmen of the Board of Governors, a position established in 1934.
- Note: Prior to 1934, the top Fed post was called the Chairman of the Board of Directors of the Federal Reserve System, Fed Directors served shorter terms, and they were not as powerful as the current Fed elite.
Figure 1, below, lists the terms of the modern-era Fed Chairs’.
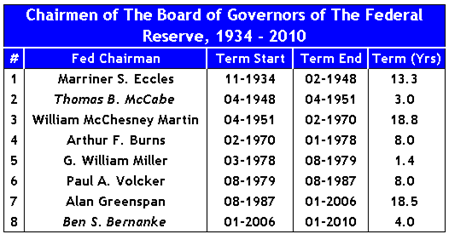
Figure 1: Chairmen of the Fed’s Board of Governors
If you look closely at the figure, you’ll see that I’ve italicized two names – Ben Bernanke and Thomas McCabe:
- I’ve highlighted Chairman Bernanke because he is the current Chairman, and his first term ends in January of 2010. Assuming that he is re-appointed, his complete term of service could run much longer than the currently scheduled 4 years.
- I’ve highlighted Chairman McCabe because (as we will see below); McCabe is the “exception that proves the rule.”
Performance Benchmark
To measure the Fed heads’ performance, recall the Misery Index of economist Arthur Okun. The “Misery Index” is simply the sum of the:
- Unemployment Rate; and
- Inflation Rate.
Okun’s index suggests that both higher unemployment rates and inflation create economic and social costs. A combination of rising inflation and more people out of work implies deteriorating economic performance, and a rise in “misery.”
Below are charts of the Misery Index and it’s constituents.
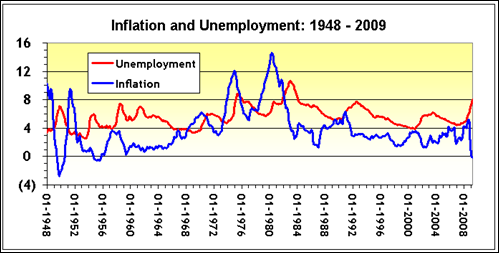
Figure 2: Inflation and Unemployment, 1948 – 2009
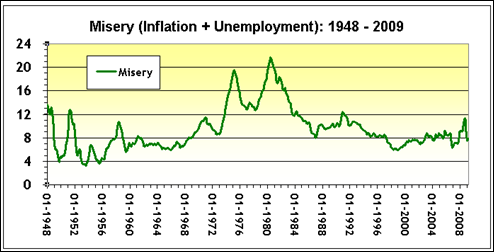
Figure 3: Misery, 1948 – 2009
As Figure 3 indicates, since 1948 (when my data begin) the worst time, in terms of Okun’s Misery, ran from the mid-1970’s until the mid-1980’s. While unemployment has risen in the last year, it has been offset in “Misery Index terms” by low (reported!) inflation rates.
Modeling The Length of Service of Fed Chairman
To “model” the length of service for prior Fed Chairman, all that we need to do is plot their a) length of service against b) the average misery level that prevailed during their term.
I’ve done this below in Figure 4.
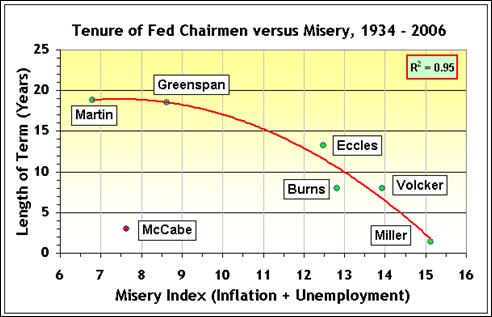
Figure 4: Fed Tenure and Misery, 1948 – 2009
As noted above, Chairman McCabe is a special case that I shall exclude, and we’ll get back to him in a moment. Leaving McCabe aside, the “expected” relationship prevails:
- Fed Chairmen associated with lower economic misery had longer terms of service than Chairmen plagued by miserable economic conditions.
Chairmen Martin and Greenspan each served almost 19 years with low misery levels: 6.8 for Chairman Martin and 8.6 for Chairman Greenspan.
Chairman Miller (appointed by President Jimmy Carter) established the peak for the Misery Index - his average misery index of 15.1 easily “explains” his short Fed tenure of just 1.4 years.
Chairman Bernanke’s misery level, since the beginning of his 2006 term (inspect Figures 1 and 3) is 8.3. If Chairman Bernanke maintains this average misery level throughout his tenure, one might expect that he would serve more than 18 years, as long as either Martin or Greenspan.
In order for Chairman Bernanke to be a “one-termer” with a 4-year term, however, the “model” and Figure 4 suggest that Bernanke’s misery would have to average about 14.75 - and he’s nowhere near that – yet.
Stress-Testing The Chairman
Federal financial journalism guidelines require that I make a passing deferential reference to the government’s “stress test”, or as it is properly called - the Supervisory Capital Assessment Program (“SCAP”).
So I shall.
As described in the SCAP Design and Implementation document of 24 Apr 2009, the adverse stress test (see Table 1, page 6) posits that unemployment will average 10.3% in 2010.
While the SCAP document does not mention inflation (think about that), let’s assume that future inflation will equal 3.3%, the average level that prevailed in 2006 – 2008 (the first 3 years of Chairman Bernanke’s term).
An assumed unemployment rate of 10.3 and inflation rate of 3.3 produce a Misery Index of 13.6.
- Question: How long would a Fed Chairman serve if the Misery Index averaged 13.6 during his term?
- Answer: About 8 years, equivalent to either Chairman Arthur Burns or Paul Volcker.
On a steady-state basis, the stress test metrics are roughly consistent with the suggestion that Chairman Bernanke will be reappointed as Chairman in 2010 – but that’s it. If the adverse stress test conditions are realized, he will be replaced in 2014.
Chairman Thomas McCabe, 1948 - 1951
Finally, a few words about that “standing panda” of a Fed Chairman, Thomas McCabe. McCabe was an extraordinarily principled Fed Chair who stood up to the Treasury Secretary during wartime, forcing the Treasury to back down from inflationary policies. This integrity came at a cost – McCabe’s position.
As described by the Richmond Fed, after the US economy slipped into the 1949 recession, the Federal Open Market Committee determined that loose credit and low interest rates were needed to revive the economy. This policy “pleased the Treasury, [since it] resulted in cheaper debt financing.”
But the economic rationale for expanding credit -and lowering rates- faded as the economy revived with the 1950 onset of the Korean War. The mix of “economic expansion, artificially low interest rates, and new …debt financing” to finance the war would have generated serious inflation.
In response, the Fed raised rates, infuriating the Treasury:
- Conflict between the FOMC and the administration ensued… Thomas McCabe … [and other Fed officials] pressed for a relaxation of the interest rate peg [that kept rates low].
- They argued that the inflationary pressure generated by the [low rate] peg would undermine war financing by creating inflation. After months of intense sparring in the public eye, the Treasury backed down and settled its argument with the Fed.
- However, the chairmanship of Thomas McCabe was a casualty of the conflict [between the Treasury and Fed, and the Treasury Secretary]… told [President] Truman that he could not work with McCabe… McCabe resigned in March.
Biography, Thomas Bayard McCabe, Federal Reserve Bank of Richmond
This is why McCabe is a “special case”, and why I excluded his 1948 – 1951 term from my model.
His term was short because he was effective, not because he was weak. Viewed broadly, his term should be considered to be a part of that of the legendary William McChesney Martin, who followed him as Fed Chair and served successfully for almost 19 years.
Between now and year-end, don’t be bamboozled by suggestions (from the Treasury, as in 1950…?) that Chairman Bernanke will leave.
If Chairman Bernanke produces green shoots, and then leaves, it would be as rare as a standing panda.
![]()
I used to work with numbers for a living. I’ve had about as much of this stress test pandering as I can bear as I search for a new job, or at least my next idea. Till next time.


1 response so far ↓
1 Ira Artman’s Sterling Slivers: 40 Weak Years … And A Rule? - The Long and Short of Bond & Equity Returns // May 11, 2009 at 5:25 pm
[...] used to work with numbers for a living. Pigs, pandas, and mules – oh my! - could my next job be in Kansas as I continue my search for a new job, [...]
Leave a Comment